We’re in the middle of a big change in baseball, thanks to “Moneyball.” Now, every field is filled with new gadgets. They all claim to make your players better.
Coaches are getting overwhelmed. They’re told to use analytics, but they don’t have the time or money.
This isn’t about judging anyone for not using the latest tech. It’s about understanding what’s real. We’ll look at the best bat, ball, and arm sensors out there.
We’ll cover everything from cheap apps to expensive systems. It’s like getting ready for the game. Know what you’re up against before you start.
Metrics That Matter by Age: Bat Speed, Attack Angle, Spin, Command
Trying to get a 10-year-old to chase elite metrics is like training a toddler for a marathon. It’s not just inefficient, it’s missing the point of development. The real magic of smart tech isn’t in the data dump. It’s in the curated insight. So, let’s talk about which numbers are actually meaningful signposts on the road to growth, and which are just fancy digital noise.
For the young hitter, think force production and pathway. Is the swing generating power? Is the bat meeting the ball in the right place? The two metrics that answer these questions are bat speed and attack angle.
A tool like the Blast Motion Bat Sensor (around $150) is your guide here. It tracks swing metrics with real-time feedback. Used by most MLB teams, it gives you data like bat speed at contact and attack angle. For an 8-to-12-year-old, watching bat speed increase over a season shows they’re getting stronger and more efficient. A consistent, slightly upward attack angle means they’re learning to drive the ball, not just chop at it.
Now, for the developing pitcher, the conversation shifts. It’s less about the absolute number on a Rapsodo screen and more about the story behind it. A 12-year-old with a high spin rate is interesting, but a 12-year-old who can repeat his spin and location is developing.
The Rapsodo PRO 2.0 is the gold standard here, measuring over 20 metrics. But for youth arms, focus on the consistency of spin axis and the early signs of command. Chasing a max velocity or spin rate reading is a recipe for injury and frustration. Instead, look at the spread of data. Are most pitches in a similar spin range? That’s control. Is the release point consistent? That’s command in its infancy.
This age-appropriate focus keeps the process healthy. It turns data from a source of anxiety into a map for the next practice. The goal is athletic development, not creating a spreadsheet prodigy. For a deeper look at how this fits into the bigger picture, understanding the path to college placement in youth baseball is key.
| Age Group | Hitting Focus | Pitching Focus | Recommended Tool & Key Metric |
|---|---|---|---|
| Ages 8-10 | Making solid contact, basic mechanics | Throwing strikes, arm health | Blast Motion: Time to Contact (simplicity over power) |
| Ages 11-13 | Increasing bat speed, optimizing attack angle | Spin consistency, basic command | Blast Motion for hitters; Entry-level Rapsodo data for Spin Axis Consistency |
| Ages 14-16 | Peak hand speed, power output | Advanced command, pitch movement profiles | Rapsodo PRO 2.0 for Spin Rate & Movement analysis |
| Key Insight | Bat speed builds the engine; attack angle steers the car. | Repeatable spin predicts future command better than elite max spin. | Tools should explain the “why,” not just list the “what.” |
See the pattern? The tools get more sophisticated as the athlete does. But the core principle remains: data is a guide, not a goal. A great attack angle for a 10-year-old looks different than for a 16-year-old. The consistency of spin from a rapsodo for a 13-year-old is more valuable than one spectacular reading.
So, before you get lost in the numbers, ask this: Is this metric helping my player understand their movement today? Is it pointing toward a sustainable improvement for tomorrow? If the answer is yes, you’re reading the data right. If not, you might just be reading noise.
Data pitfalls: small samples, chasing maxes, ignoring contact quality/decision making
With a radar gun and a spreadsheet, you might feel like a genius. But, you’re often measuring the wrong things. Technology doesn’t fix bad thinking; it just shows your biases in high definition.
The first trap is the small sample size. You might record a 92 mph exit velocity in just three swings. But, this doesn’t show a player’s true ability. Real skill is shown over time, not in one moment.
Then, there’s the focus on the maximum. Everyone wants the highest exit velocity or pitching speed. But, a player who hits one ball far and misses others is not good. He’s just a show.
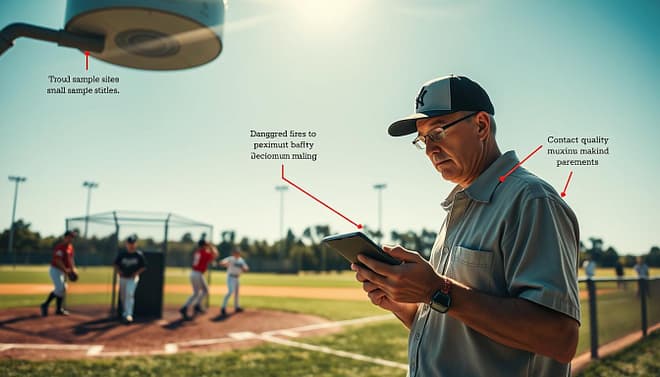
Chasing the highest numbers can lead to ignoring important skills. A hitter might have a high exit velocity but always ground out. A pitcher might throw fast but walk batters because he can’t control his pitches.
Just having data isn’t enough. You need to understand it. A fast fastball is useless if it’s always in the wrong spot. A strong swing is pointless if it misses the ball.
To truly know your athlete, you need a consistent way to record and review data. You can’t plan training without knowing the athlete’s full picture. Was that 92 mph exit velocity on a perfect pitch or a tough one?
Let’s look closely at how we use data. Don’t confuse a radar gun reading with a training plan.
| Common Data Pitfall | What the Data Shows | What It Often Hides |
|---|---|---|
| The Small Sample | A single impressive metric (e.g., one 90 mph fastball). | Consistency, mechanics under fatigue, and performance against varied opponents. |
| Chasing the Max | Peak physical performance on a perfect day. | Average performance, sustainability, and the development of repeatable skills. |
| Ignoring Context | Raw numbers like exit velocity or spin rate. | Contact quality (barrel %), pitch command location, and in-game swing/take decisions. |
To fix these issues, change your mindset. Focus on building a complete profile, not just finding the highest numbers. Look at averages, not just maxes. Review data in groups of 20-30 pitches or swings, not just 3. Ask “how often?” not just “how hard?”
Your most important tool is your own skepticism. Use data to ask better questions, not to jump to conclusions.
Ethical use: privacy, camera policies, sharing with colleges
Let’s talk about who and how we use Pocket Radar on a 16-year-old. It’s not just science; it’s a big responsibility. We’re collecting personal data and performance records. Who owns this data? What can we film? And how do we share it without being a bother?
Privacy, camera policies, and sharing with colleges are key. Ignoring these can make you a data hoarder with legal issues.
| Area of Concern | Ethical Practice | Unethical Practice |
|---|---|---|
| Data Privacy & Ownership | Clear, written consent from parents/guardians defining data use, storage duration, and ownership. The athlete’s family should own their raw data. | Assuming implied consent. Storing data indefinitely without purpose. Selling or sharing data with third parties (e.g., equipment companies) without explicit permission. |
| Camera & Recording Policy | Cameras only in public training areas (cage, field). Strict “no recording” rules in locker rooms and private facilities. Announce when filming. | Filming anywhere, anytime. Using video for non-coaching purposes (e.g., social media bloopers) without consent. Secretive recording. |
| Sharing with Colleges | Sharing curated, contextualized reports—not raw data dumps. Highlight trends and baseball IQ, not just one-off max metrics. | Emailing 50GB of unlabeled Rapsodo files to a coach. Blasting every player’s data to every school. Ignoring the athlete’s choice in the process. |
| Internal Data Access | Limiting access to essential staff. Using secure platforms. Having a clear data retention and deletion schedule. | Leaving data on an unsecured laptop or shared Google Drive with weak passwords. Keeping data forever “just in case.” |
Sharing with colleges can be tricky. A D1 pitching coach’s inbox is full of emails. Your Pocket Radar file is like digital spam. It shows a lack of respect for their time and your player’s story.
To share effectively, you need to curate. Turn numbers into a story. This takes time, which is scarce.
NCAA rules limit contact. Coaches are busy. Here’s a smart move. Use your campus clubs. Students in computer science, math, or economics clubs are a goldmine. They’re eager to work for experience.
These students can anonymize data and create dashboards. They can make player summaries for recruiters. They work under strict privacy rules you set. This solves the time crunch ethically. It prepares data for sharing responsibly. It’s a real-world project for the students. For more on the legal and ethical frameworks around sports tech, this resource is essential reading.
This approach makes you a responsible data custodian. You’re not just tracking spin rate. You’re building trust. You’re protecting kids. And you’re communicating their value to colleges with clarity, not clutter. That’s being smart, not just tech-savvy.
Starter kits under $500 and under $1,500
Welcome to the guide for finding great deals in baseball analytics. We show you how to get top insights without spending a lot. Your limited budget is actually a strength. It makes you pick the most important tools.
First, let’s look at the Under $500 Guerrilla Kit. It’s perfect for those who like to be smart with their money. You’ll need a Pocket Radar Ball Coach ($299.99), your phone, and a keen eye for coaching.
The radar gives you the speed of the ball. But the real power is in your phone. Video apps let you slow down swings and pitches. You can analyze them frame by frame and share them right away. This is free.
To complete this kit, focus on free resources. Use barbells for strength, bats for feel, and talk about athlete health. The Guerrilla Kit shows that insight comes from paying attention, not just from tools.
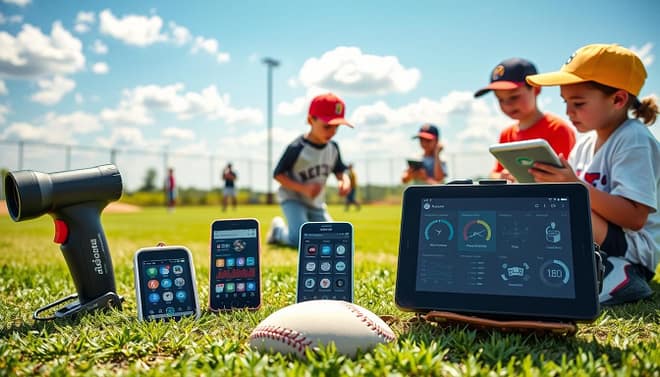
Ready for more? Check out the Under $1,500 Contender Kit. This kit adds more depth to your analysis. You keep your radar and video apps as your base.
Then, add a specialist. For hitters, the Blast Motion Bat Sensor (~$150) explains bat speed and angle. For pitchers, the Motus mThrow Sleeve ($150) tracks workload and stress on the arm. It’s like an insurance policy.
This budget might also let you get a Spark Catch LED ball for reaction training. Or, you could try a basic ball flight tracker. Now, you’re measuring mechanics and health, not just results.
Let’s talk about what gives you the most insight for your money.
- Velocity + Video: This combo is unbeatable. Knowing a fastball is 72 mph is one thing. Seeing *how* that velocity is generated—the arm path, the hip lead—is everything. Your phone is your most powerful sensor.
- Mechanical Sensors: Devices like Blast or Motus translate complex movements into simple graphs. They answer questions you can’t see with the naked eye.
- The Shiny Skip: I see you, Rapsodo PRO 2.0 ($3,500). You’re magnificent, but you’re a Ferrari in a world where we’re building reliable all-terrain vehicles. For a starter kit, you’re overkill. That capital is better spread across multiple tools.
The final play? Your weekly review becomes more detailed. You’re not just looking at a radar gun readout. You’re comparing a pitcher’s sleeve data with his video apps footage, asking smarter questions. Did his velocity dip because his mechanics changed, or is the sleeve showing early fatigue?
Start with the Guerrilla Kit. Then, grow into the Contender Kit. The best tech stack isn’t the most expensive. It’s the one you’ll use every day to make better decisions.
Sample dashboards and weekly review cadence
A spreadsheet full of numbers is not very useful. It’s like a screen door on a submarine. The real magic happens when you create a simple dashboard.
Imagine using Google Sheets, not NASA’s mission control. Your dashboard combines hard data from a Pocket Radar with soft feedback from a weekly well-being survey. It can also include detailed data from tools like the real-time pressure metrics from a FlexPro Grip glove. This is where your workload trackers shine, showing trends, not just daily totals.
The review process is straightforward. A 20-minute weekly huddle is all you need. You’re not focused on daily max velo. Instead, you’re looking for the trend that shows a pitcher’s workload is increasing while their sleep score is decreasing. This rhythm of weekly progress tracking keeps athletes engaged and developing. You celebrate the process, like cleaner mechanics and better recovery, not just the radar gun reading.
This final piece ties everything together. Your tech becomes a real tool, not just a toy. You use dashboards and workload trackers to tell a smarter, safer development story for your player. That’s a win you can measure.